SNR Comparison with 2p Single Bandwidth
The dBWRARE repository on GitHub hosts data and scripts to reproduce the SNR measurements described here.
Sequence plot for the measurements are available here:
Data acquisition
The single bandwidth pulse sequence was implemented according to [1]. The number of shots was doubled and each phase encoding line was acquired twice in a TR interleaved manner. Odd shots thereby form one measurement, while even shots form a second. The scan time is doubled and the temporal difference between lines is TR (3500 ms).
Odd shots and even were independently fat/water separated.
Matrix size 320x320, field of view 240 mm, ETL = 16, partial Fourier 0.75 (both datasets), dephasing times -0.2/1.2 ms (dBW-RARE) and -1.0/0.0 (single BW)
Noise and SNR estimation
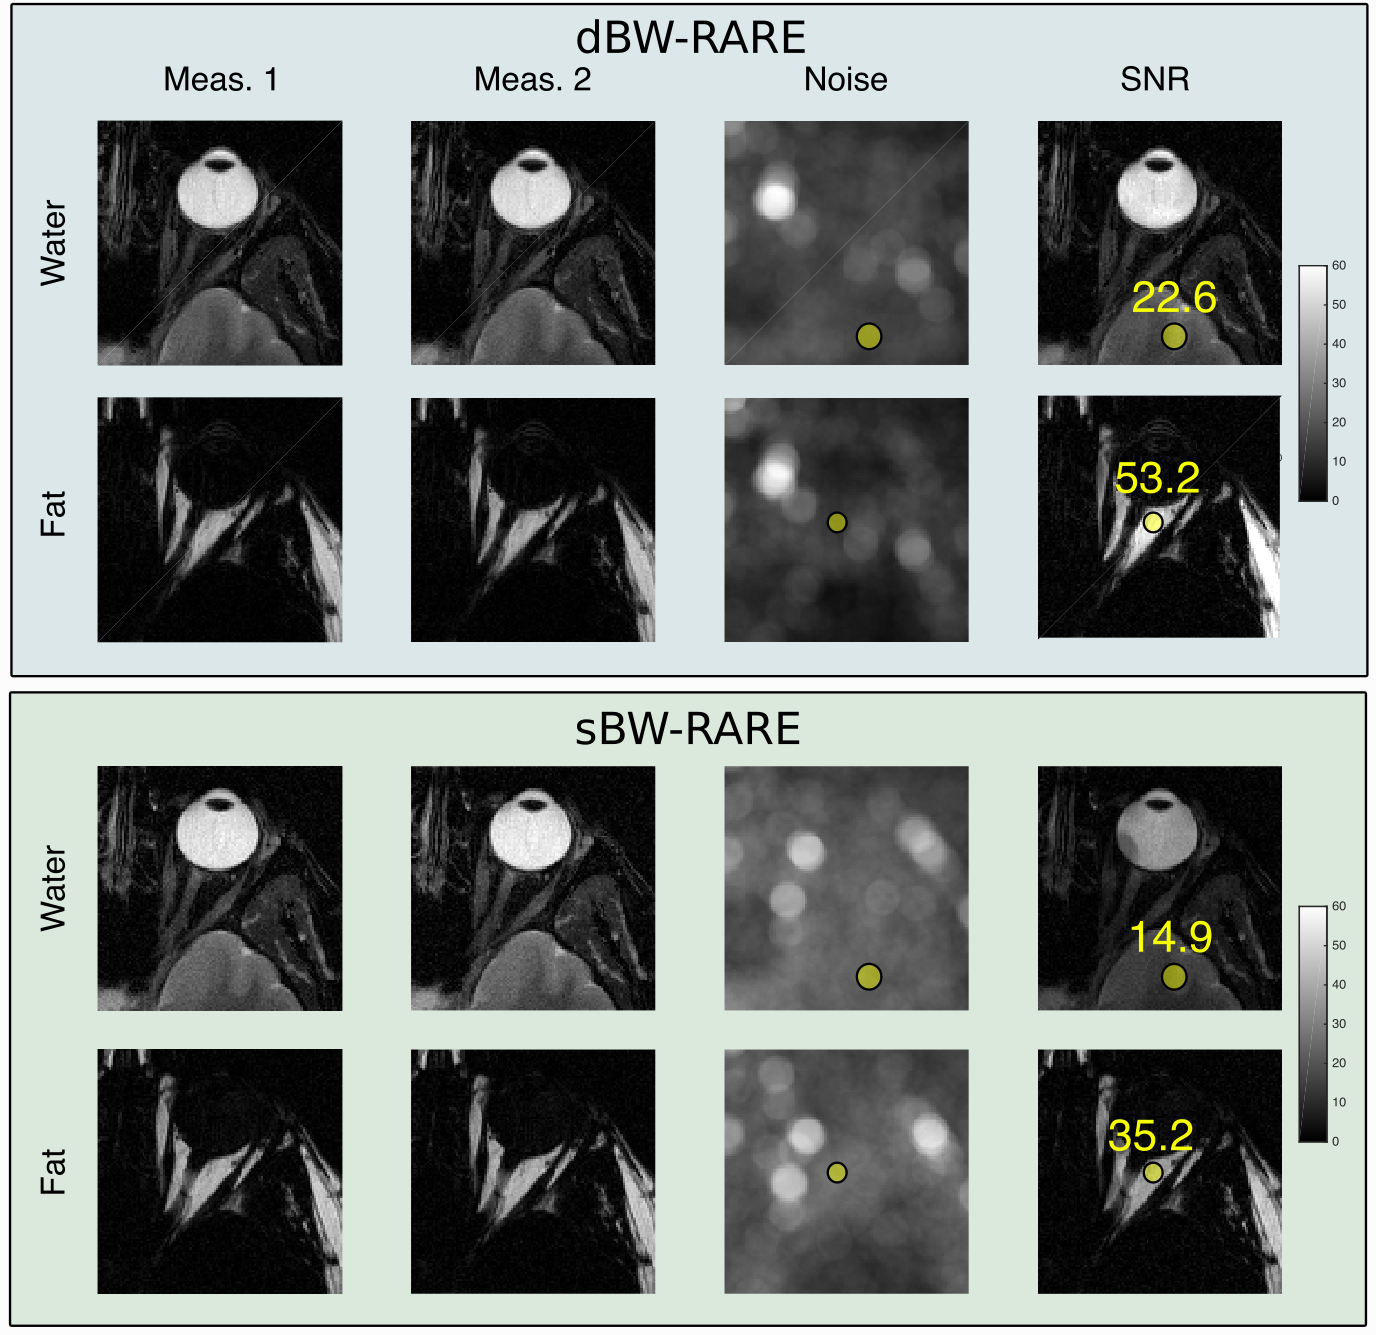
Noise was estimated by calculated by subtracting the estimated images from measurement 1 with measurement 2. The resulting images were squared, followed by a division of 2 to account for the overestimation from subtracting two measurements. The resulting images were smoothed with a 6 mm circular filter to generate noise maps. SNR maps were formed by dividing measurement 1 with the noise map.
Regions of interest were placed in the the fat surrounding the optic nerve, and in the gray matter. The same ROIs were used for both acquisitions.
Theoretical SNR gain comparison
A comparison between the time spent sampling can give an approximation of how much SNR improvement can be expected. The dephasing times for sBW and dBW are shown below:
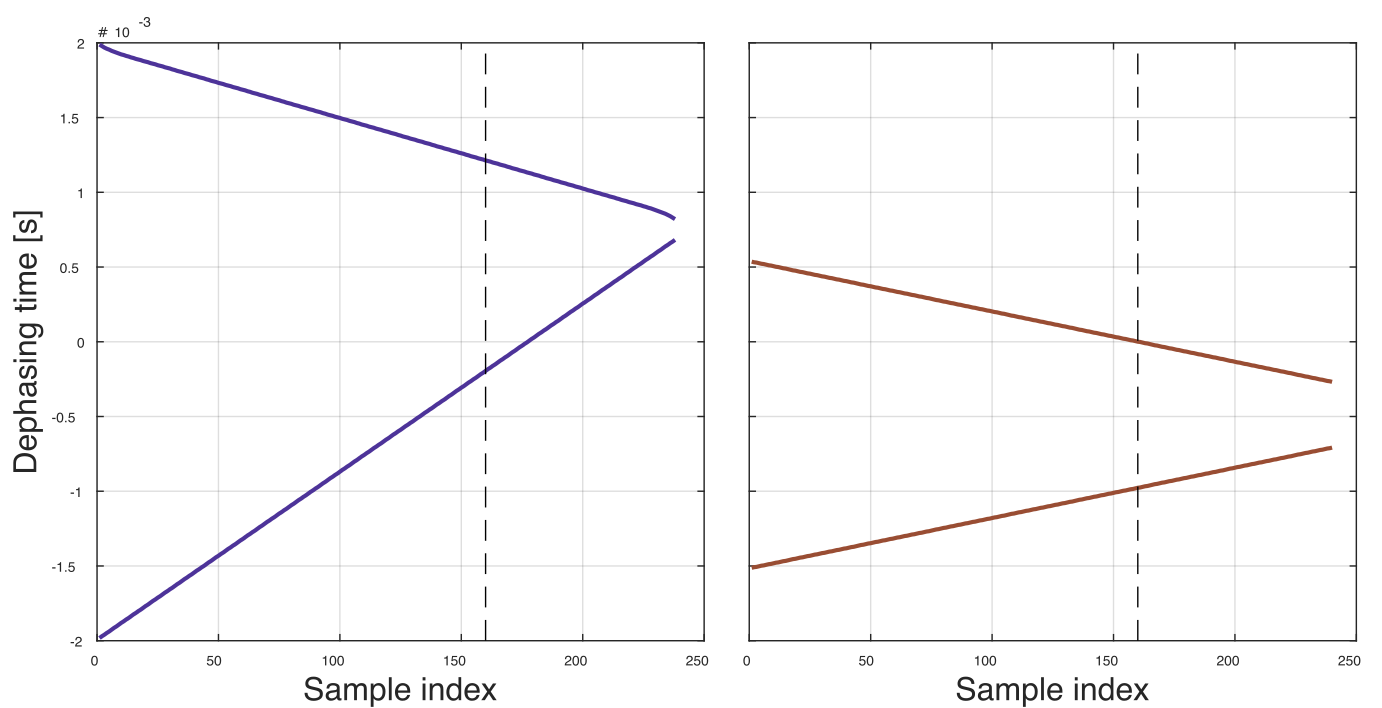
The theoretical maximum SNR improvement is the square root of the ratio between sampling durations.
Results
The measured SNR gain was 1.515 and 1.513 from the water and fat image, respectively. The theoretical gain was 1.544
[1] Wang, X. et al. MR Neurography of Brachial Plexus at 3.0 T with Robust Fat and Blood Suppression. Radiology 283, 538–546 (2017)
Henric Rydén
Karolinska Institutethenric.ryden@ki.se